Sharing our expertise through pioneering improvement work
Ofsted’s annual fostering data collection 2017/18
Is there a crisis looming?

Data on fostering in England for 2017/18 [1] was published at the end of January and while it contains some interesting insights it raises a lot more questions than it answers. For a start the data is collected by Ofsted via an annual data return [2] and produces different results from the Looked After Children (LAC) data published by the Department for Education (DfE) [3], which is generated from a different statutory annual return – so which data is correct? But the key thing for me with data is being able to determine what needs to happen next to improve the situation and that’s just not possible from this data. The Fostering Network’s State of the Nation’s Foster Care 2019 report [4] has recently raised concerns about the lack of progress in reforming the sector and a lack of insightful data analysis would contribute to that.
The number of children in foster placements is steadily rising but the proportion of children in foster placements is falling – is this a good thing or a bad thing?
From our DfE Social Innovation Project [5], which focused on achieving permanence through foster care placements, we have found that it is more important to know whether children are in the right type of placement. If children are not being placed with foster carers because there are not any suitable placements, that would point to a problem. I cannot find any data published on the split of LAC by permanency plan or data on the number of children who are not in a foster placement but who should be.
Combining the Ofsted and LAC data shows us that there is a decreasing proportion of LAC in fostering placements:
| 2014-15 | 2015-16 | 2016-17 | 2017-18 | |
| Number of LAC | 69,470 | 70,400 | 72,590 | 75,420 |
| Year-on-year increase | 1% | 1% | 3% | 4% |
| Number in foster placement | 51,805 | 51,805 | 52,005 | 53,040 |
| Year-on-year increase | 1% | 0% | 0% | 2% |
| % LAC in foster placement | 75% | 74% | 72% | 70% |
The DfE-published LAC data gives a slightly different picture – a much smaller fall – and shows that the proportion of children in adoptive placements has also fallen, while there has been an increase in placements with parents, secure units, children’s homes, semi-independent living and residential settings.
Data published by DfE on placement type
| Proportion of LAC in… | 31/3/2015 | 31/3/2016 | 31/3/2017 | 31/3/2018 |
| Foster placements | 74% | 73% | 73% | 73% |
| Adoptive placements | 5% | 4% | 4% | 3% |
| Placements with parents | 5% | 6% | 6% | 6% |
| Secure units, children’s homes, semi-independent living | 10% | 11% | 11% | 11% |
| Other residential settings | 1% | 1% | 1% | 2% |
The shifts are small: generally only 1 percentage point over three years, but for the last three categories the shift has been meaningful given their respective baselines. So is a lack of suitable fostering placements leading to children being placed in residential settings? Or are the needs of the children in care increasing in complexity, meaning that foster care is no longer a suitable placement for a growing number of LAC?
The Ofsted return collects data on placement type for each child, and I think it should also request information on the child’s permanency plan and aggregate data on the number of children not in a foster placement contrary to their plan. This would give us a clearer idea of sufficiency in the fostering system and may encourage plans to be appropriately updated.
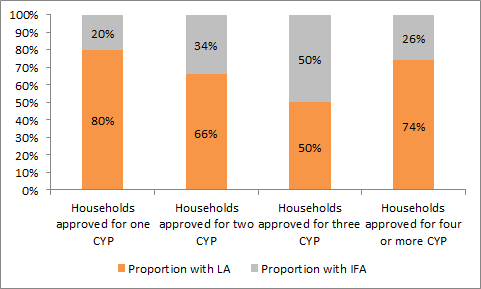
The split in LA:IFA approved households has been relatively steady for five years at 64:36, but IFAs have as many households that would be able to place 3 children and almost as many BME carers as LAs. Do LAs need to do something different?
The data shows that at the end of March 2018 there were 12,845 households approved to care for three children, of which 6,430 are with IFAs and 6,415 are with LAs. Similarly, IFAs have 5,220 BME carers, while LAs have 5,465. By contrast, LAs have 80% of all the carers who would care for just one child.
LA/IFA share of multi-placement fostering households as at 31 March 2018:
This makes me wonder about a few things:
- Do LAs specifically focus on recruiting households who will care for a single child, perhaps because that is where they have the greatest need?
- Are households who can accommodate three children or young people needed in significant numbers that they should form part of an LA’s mainstream recruitment activity or not?
- Do LAs need to do more to attract BME carers?
Based on our experience so far in recruiting and assessing foster carers for Croydon Council [6], we have not identified a specific need for single placement carers – in fact there appears to be a significant need to be able to place siblings together. The Ofsted analysis has a section on ‘Brothers and Sisters’ that resonates with this. This section reports on the number of siblings assessed and the number of siblings not placed to plan and shows that there has been an increasing trend in the proportion of siblings, and sibling groups, not placed to plan.
Trend in siblings not being placed together as per their plan:
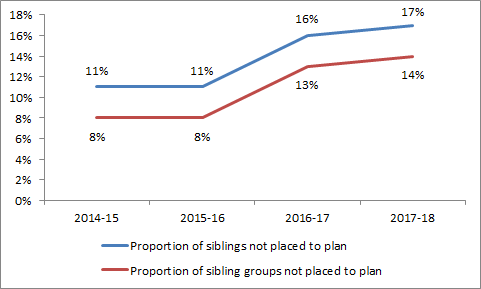
This suggests to me that the sufficiency of multi-placement carers is worsening and should be a focus of LA activity. I think the Ofsted collection should include a question on the sibling group size for each child and whether the group had been placed separately contrary to the plan.
In terms of the third question, I looked at ethnicity by the proportion of carers rather than absolute numbers.
Proportion of foster carers by ethnicity:
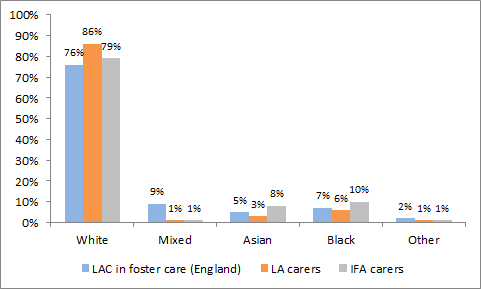
This made me realise that there is a problem with looking at the ethnicity of individual carers as I was struck by the low proportion of mixed-race carers compared with the proportion of LAC in foster carer who are mixed-race. To me this disparity does not by itself represent an issue and in our work we look at the proportion of fostering households that consist of mixed-ethnicity couples, which can also be derived from the data collected by Ofsted.
Is there a shortage of fostering placements in England?
The data states that there were 87,120 placements available in total at the end of March 2018. 61% of these (53,205) were occupied by a child, 18% were unavailable (15,645) and 17,150 were vacant (20%). It seems illogical to think that 17,150 vacancies (of which 9,550 are LA placements) represents a shortage of placements but again the problem is the lack of nuance in the data. For unavailable places, when we work with agencies we distinguish between ‘positive’ and ‘negative’ reasons for unavailability – for example, Staying Put is a ‘positive’ reason, as is meeting the needs of a child in placement or where a child is about to be placed; carer circumstances (break, resignation, investigation etc) are potentially ‘negative’ and we would attempt to learn from these as part of our improvement work.
There are a number of different types of fostering placements, as the data demonstrates. Unhelpfully though the data only tells us how many households offer a particular type. This means that we don’t know how many placements are available for each type, which is more important. What we really need to know is how many children are not in the right type of placement (including being placed with siblings) and how many placements there are of each type, broken down by how many children could be placed together.
Similarly, the data on foster carer de-registrations does not tell us how many placements of each type have been lost. It would be good to be able to compare this with how many new placements are created through newly approved households to track turnover meaningfully – again the latter is reported on in terms of households. I think it would also be good to know the reasons for de-registrations and the average length of service. This would tell us if there is a significant proportion of households whose de-registration might have been avoided.
Are our children safe?
The data shows that in 2017/18, 8% of fostered children went missing at some point. The analysis indicates that 53% of the children went missing primarily due to contact with family (either to avoid it, to have unsupervised contact or in reaction to having had contact). However for 20% the reason is recorded as ‘any other known reason’ and for 17.5% it is ‘reason unknown’ – these are the two next largest categories. So for the most vulnerable children in our country, there is no data published on the reason for 37.5% of them. That proportion is too big. Given the current concerns about county lines, for example, the data collected must be more nuanced, as otherwise it will become irrelevant.
Linked to this is the data on Return Home Interviews (RHI), which must be offered to a child when they return. The child can refuse, so for me the important data to track is how many incidents resulted in the offer of a RHI (so that we can track compliance) and where the child declined what was the level of risk. Based on the data collected, we could perhaps use the reason and length of time missing as proxies for risk. As it is, I don’t know if 43% of children not having a RHI is good or bad, though such a high proportion instinctively seems bad to me. For example, we don’t really know what proportion of these are 17 years olds who missed their curfew by minutes and how many were more substantive. A more detailed analysis may then also tell us why there is such a disparity between LA- and IFA-placed children: 60% of children placed with IFA carers who went missing did not have a RHI in 2017/18, compared with 32% of children placed with LA carers. We will be writing a blog on children going missing soon.
Lastly there seems to be some positive news about Staying Put, where a young person continues to live with their foster carer after they turn 18, as there was a 3 percentage-point increase from 2016/17 to 2017/18. However, the trend over six years is slightly downward nationally, due to a decline for children placed with IFA carers.
Proportion of young people in foster care who became 18 and remained living with their former foster carer:
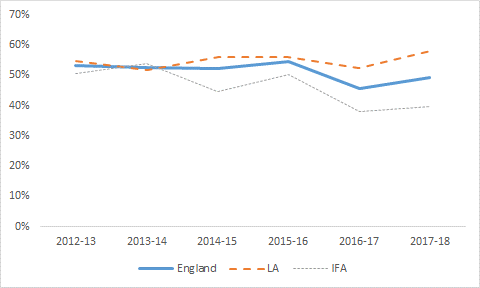
So what is driving the difference for IFA placements? Is it that IFAs have a stronger business focus meaning that they don’t want to lose assets (foster care placements), or if more was done to inform IFA carers about Staying Put would the gap would disappear? Or perhaps children placed with IFAs are further from home. The data can’t tell us this, but it is worth finding out as it would inform any strategy to increase the take up of Staying Put – if we want more young people staying put do we need to increase the number of children in long term placements with LA carers?
As always, I would like to get my hands on the raw data to explore these questions – the fostering diagnostic we do for individual agencies enables us to provide them with a valuable insight into their fostering service, and Coram Voice’s surveys for children in care (Bright Spots) and children leaving care (Your life beyond care) [7] give a unique perspective on services from the child’s point of view.
It might be that I’m focusing on the wrong things, so I would be interested to hear what you think would be useful to know from the data collected.
References
[1] https://www.gov.uk/government/statistics/fostering-in-england-1-april-2017-to-31-march-2018
[2] https://www.gov.uk/government/publications/ofsted-annual-fostering-data-collection
[3] https://www.gov.uk/government/collections/statistics-looked-after-children
[4] https://www.thefosteringnetwork.org.uk/policy-practice/research/state-nations-foster-care-2019
[5] https://www.coram.org.uk/news/coram-awarded-innovation-funding-support-local-authorities-understand-needs-children-their-care
[6] http://news.croydon.gov.uk/leading-childrens-charity-to-promote-fostering-in-croydon-as-council-plans-to-bring-service-back-in-house/
[7] https://coramvoice.org.uk/brightspots
You may also be interested in:
Data Visualisation in Social Care
Adoption in England – can we predict the state of the system?
Adoption in England – a system under pressure?
One response to “Ofsted’s annual fostering data collection 2017/18”
Leave a Reply
You must be logged in to post a comment.
To find out more about what we offer to our members and how to become a member please visit the Join Coram-i page.
[…] To complement this analysis, I have also looked at the recently published Ofsted Fostering in England data[3] to give a greater insight into missing incidents specifically for children in foster care. The latest Fostering in England data were published in January 2019 and you can find an overview of the more general themes coming out of the data here. […]