Sharing our expertise through pioneering improvement work
Adoption in England – a system under pressure?
What the published data tells us

The latest national data on adoption in England has just been published[1]. A hard look at this data reveals that underneath some positive headlines there is clear evidence that more children are coming into the system now than leaving and there are now not enough adopters available to meet demand – in November 2016 I predicted that the tipping point would be in December 2017 but the data now shows it happened earlier. With so much government investment and effort in adoption reform over recent years, the data begs the question whether the early gains we saw from the reforms are being lost.
National data has been published on a regular basis since 1 April 2014, drawing on voluntary quarterly returns of a defined data set from local authorities and voluntary adoption agencies. Since the return is voluntary, the figures quoted are a rounded estimate of the national volumes, extrapolating from the returns received. This means that the data cannot be viewed as being completely accurate, but it is the most reliable set of data available. In order to conduct this analysis I have compiled all the quarterly national data available, from 1 April 2014 to 31 December 2017, so this is how the system looked nine months ago.
Headline figures
On the face of it things look positive as the timescales for the two key Adoption Scorecard indicators are improving.
Figure 1: timescales for Adoption Scorecard indicators A1 and A2
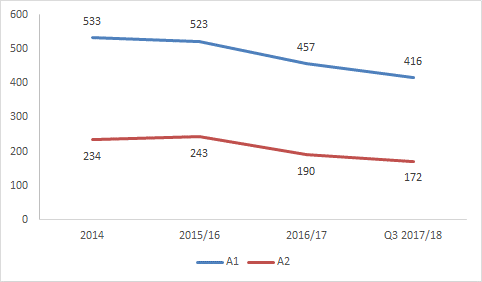
A1 refers to the average time taken to place a child following their entry into the care system, which has fallen from 533 days in 2014/15 to 457 days in 2016/17 (and 416 days in the first three-quarters of 2017/18).
A2 refers to the average time taken to match a child with an adoptive family once the Placement Order (PO) has been granted, which has fallen from 234 days in 2014/15 to 190 days in 2016/17 (and 172 days in the first three-quarters of 2017/18).
The cohort for both these measures is the children adopted during the time period – since Adoption Orders (AO) are granted on average nine months[2] after a child is placed for adoption, this effectively represents the performance of the system 18 months ago.
Figure 2: average time in care for children with a PO but not yet placed (days)
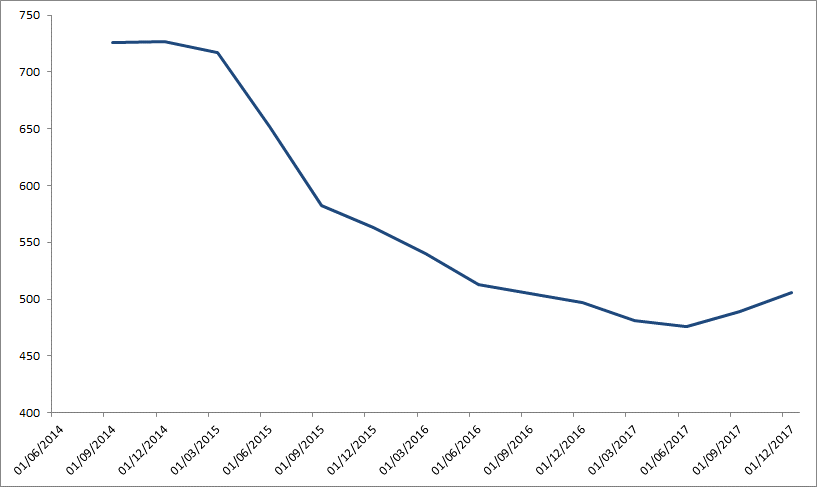
The data also shows that for children waiting to be placed for adoption, the average time they have been in care has fallen from 726 days as at 31 March 2015 to 506 days as at 31 December 2017 (Figure 2) – a significant achievement.
However there are a number of issues that should cause concern, not least the recent increase shown in Figure 2.
There are more children coming into care than leaving
Figure 3: the number of Agency Decision Maker Best Interest Decisions, Placement Orders, placements and Adoption Orders
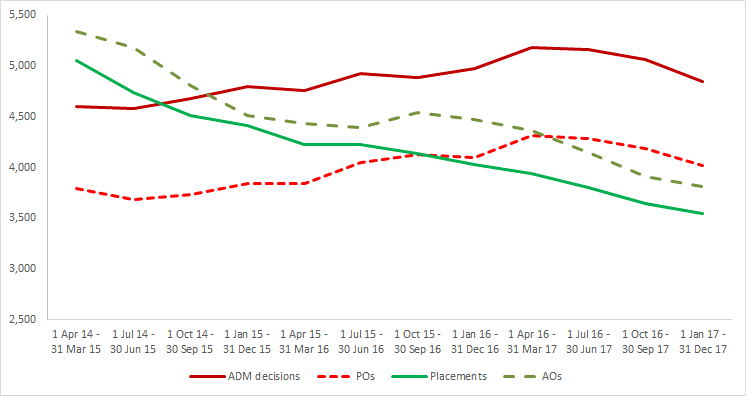
Rather than simply looking at the number of children each month, I have used 12-month rolling averages so that seasonal factors are eliminated. Figure 3 shows us that the numbers of ADM Best Interest Decisions (BIDs) made and Placement Orders granted continued to fall until 1 July 2014 to 30 June 2015 following the Re B-S judgement in September 2013[3], and then steadily readjusted upwards. There is then a peak in 2016/17 and it is imperative that we understand and appropriately intervene to ensure that the subsequent decline comes to an end – what do you think are the reasons behind the recent fall in BIDs and POs? It also shows us that the ratio of BIDs to POs has remained relatively consistent (5 to 4) throughout the time period.
Conversely there has been a significant fall in the number of children placed (30%) and adopted (29%) over the same time period.
The fall in placements and AOs cannot simply be due to the decrease in the number of POs granted immediately after the Re B-S judgement as the lag between BID and placement/AO is small. Using national statistics published by DfE[2] this lag can be approximated in months:
| 2014/15 | 2015/16 | 2016/17 | |
| BID to placement (months) | 11 | 11 | 9 |
| BID to AO (months) | 20 | 20 | 18 |
This means that we would expect to see placements increasing from the period 1 July 2015 to 30 June 2016, a year after the number of BIDs started to increase, and a rise in AOs starting from 1 April 2016 to 31 March 2017. Instead the number of children placed has consistently decreased since April 2014 and the same is largely true for AOs, aside from a slight rally between 1 October 2015 and 30 September 2016, which was likely due to a backlog of cases rather than a significant upturn in volume.
There are fewer adopters available
The data also shows us that the number of adopters has fallen significantly. Again, I have looked at this in rolling 12-month periods to eliminate seasonal factors.
Figure 4: the number of Registrations Of Interest accepted and families approved (LA and VAA)
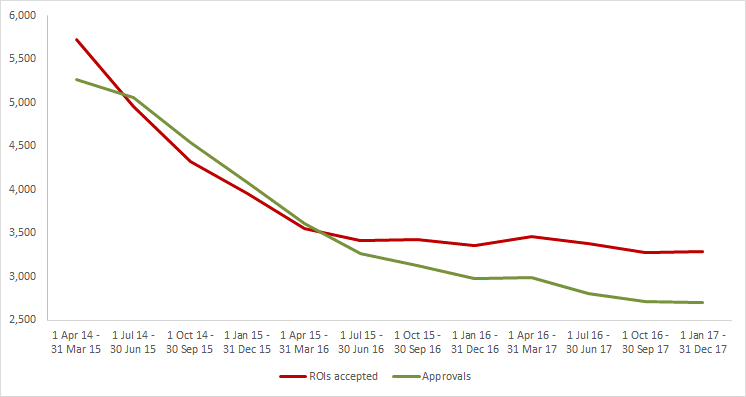
As you can see in Figure 4, the number of ROIs accepted fell (by 43% from 5,730 in 2014/15 to 3,290 between 1 October 2016 and 31 December 2017). Similarly the number of families approved fell (by 49% from 5,270 to 2,700). The proportion of approvals to ROI accepted has varied between 70 – 90%, though recently it has been steady at 80%.
Figure 5: the number of assessments underway and families approved and waiting as at
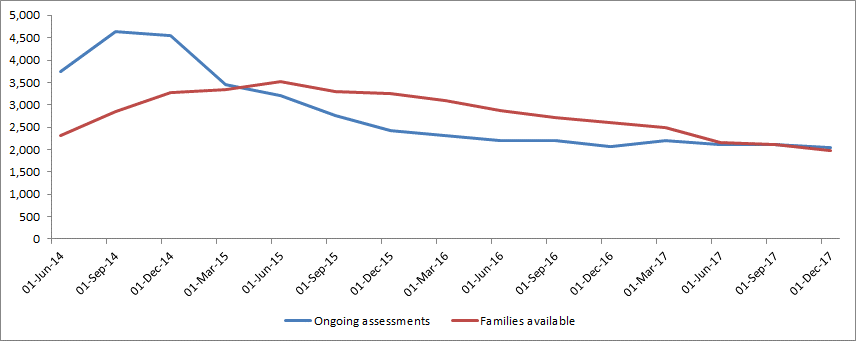
The fall in ROIs accepted is reflected in a decrease from October 2014 in the number of assessments being undertaken and from July 2015 in the number of adopters without a child placed.
But are there enough adopters?
The fall in approvals coupled with the increase in POs strongly suggested that there would not be enough adopters available for the number of children we need to find families for[4]. I wrote a paper for the ALB in November 2016, based on the data that was available at the time, estimating that we would have an insufficient number of families available by the end of 2017. The data published (Figure 6) now suggests that we reached that point a month or so sooner. This is a simplistic analysis as it cannot take into account the characteristics of the children waiting and whether there are suitable adopters waiting for them.
Figure 6: the number of families needed compared with the number of families available
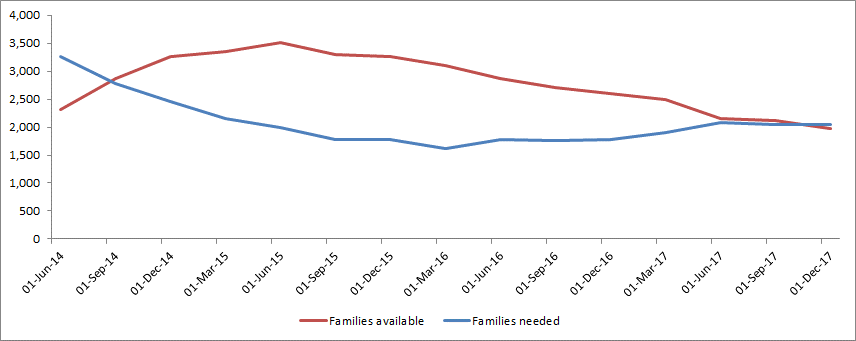
This means that the number of new families approved must keep up with the number of new families needed.
Our forecasts suggest that it is very likely that this has not happened over the past year. Figure 4 shows that the number of ROIs accepted has plateaued at around 3,300 per year and we would expect to see a similar trend in the number of approvals in the nine months from January to September 2018, as that’s the average time taken from ROI to approval. As the data indicates that around 80% of ROIs accepted result in adopter(s) being approved, I estimate that the number of families approved in the past year will be around 2,630, enough to give homes to 3,420 children if the average sibling group size remains around 1.3 children.
Additionally, there are signs of a fall in the number of POs granted. If the fall continues at the same rate, I estimate that the number of POs granted over the last 12 months will be around 3,640 children. This means that that there would have been a shortfall of 170 families this year.
From the data published I have calculated the following rule of thumb:
in order to ensure we have enough adopters available we need the number of ROIs accepted to be at least 75% of the number of adoption plans approved by ADMs over the given time period.[5]
So what does this mean for children?
Once a PO is granted, children either go on to be adopted or their adoption plan is changed. If there are not enough adoptive families then children will end up waiting longer to be adopted, or not adopted at all.
While data is also collected on the children whose plan is changed from adoption as part of the quarterly return no analysis of this data has ever been published, perhaps because it is too unreliable. Given the potential consequences of this for every child not placed, this is a serious concern. If there is an increase in the number of children for whom the plan is changed from adoption, the characteristics of those children (the longer a child waits for a family the less likely they are to be adopted) and the outcome for them must be understood as these children are among the most vulnerable in our society. Are you seeing an increase in the number of POs being revoked?
Figure 2 shows that children are already be waiting longer to be placed. There has been a 30-day increase in waiting time over the last two quarters of data published (from 476 to 506 days) and so this cannot be considered a blip. There has been plenty written on the impact of delays in adoption on the life chances of children so I won’t repeat it here. The gains made as a result of the Adoption Reform Programme that the Government started in 2012 are quickly being lost. The improvements we have seen are at risk of not being sustained, which would be a terrible shame for the children affected. Additionally, in the context of a sector that is struggling to fund services, LAs should bear in mind that an increase of just 25 days in achieving adoption for 4000 children a year would cost the sector at least £10m[6], and failing to find adoptive families for just 30 children a year costs £1m for each year they remain in care.
Our next step is to try and understand what is behind this change and what can be done to reverse it.
What do you think are the causes for the shortfall in adopters and how do we tackle the problem?
Kevin Yong, October 2018
Kevin Yong is the Managing Director of Coram-i, a change consultant and an analyst. He has a wealth of experience of supporting adoption services to improve, and is well respected in the sector for his insightful use of data.
Footnotes
[1] http://www.cvaa.org.uk/asglb/data-on-adoption/
[2] https://www.gov.uk/government/statistics/children-looked-after-in-england-including-adoption-2016-to-2017
[3] http://www.familylawweek.co.uk/site.aspx?i=ed117048
[4] To work out the number of families needed I have taken the number of children waiting and adjusted this to take into account siblings who are placed together for adoption – the data suggests that the average sibling group size is 1.3 children
[5] Data indicates that 80% of BIDs result in a PO, 80% of ROIs accepted result in approval to adopt, and the average sibling group size is 1.3 children.
[6] Selwyn, J.; Sempik, J.; Thurston, P.; Wijedasa, D. (2009) Adoption and the inter-agency fee estimated that £100 per day is spent on a child in foster care. We have used this figure and not adjusted for inflation.
You may also be interested in:
‘Early Permanence’: Foster to Adopt Placements – the Approach and Benefits