Sharing our expertise through pioneering improvement work
Adoption in England – can we predict the state of the system?
What can the past tell us about the future state?

Adoption data for the financial year 2017/18 is now available and while some aspects look more positive, following revisions to previously published data, there are still causes for concern. In addition to my analysis of this data, this month I am going to make a prediction about what I think the future holds – I estimate that 3,500 children would be matched in 2018/19 and 2,700 children would be waiting on 31 March 2019. Fingers crossed this doesn’t make me look foolish in a year’s time!
Headline figures
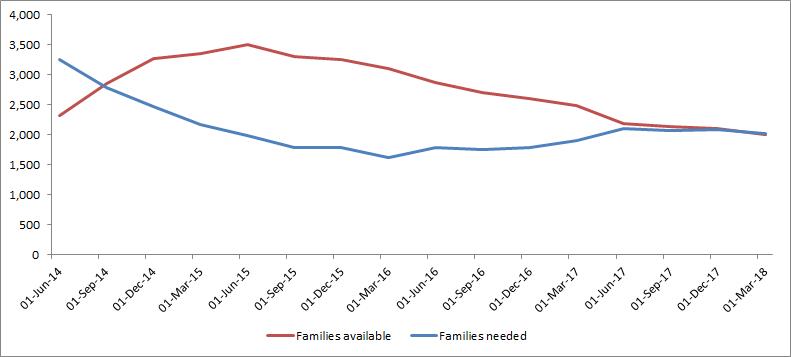
- The point at which there were not enough families available occurred between January and March 2018, rather than between October and December 2017, so slightly more positive picture.
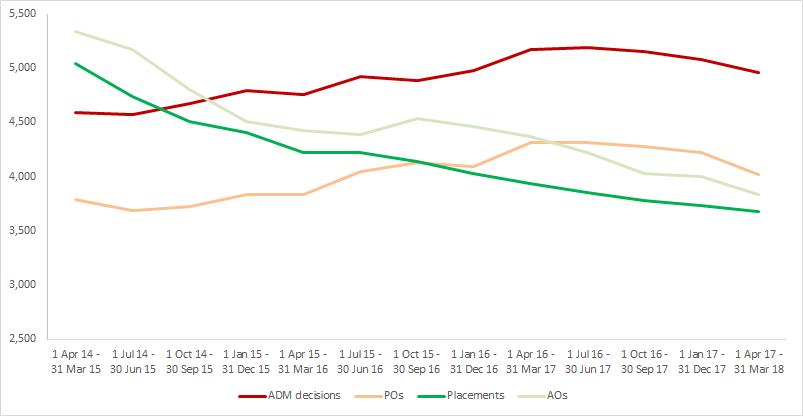
- There has continued to be a fall in the number of children for whom the Agency Decision Maker (ADM) decided that adoption was in their best interest (BID), though the ratio of these Decisions to Placement Orders (POs) has remained steady at around 80%, and the trend for placements and Adoption Orders (AOs) has not really changed. The fall in ADM BIDs helps relieve some of the pressure to recruit more adopters but the question is then whether the right permanence plan is being pursued for children.
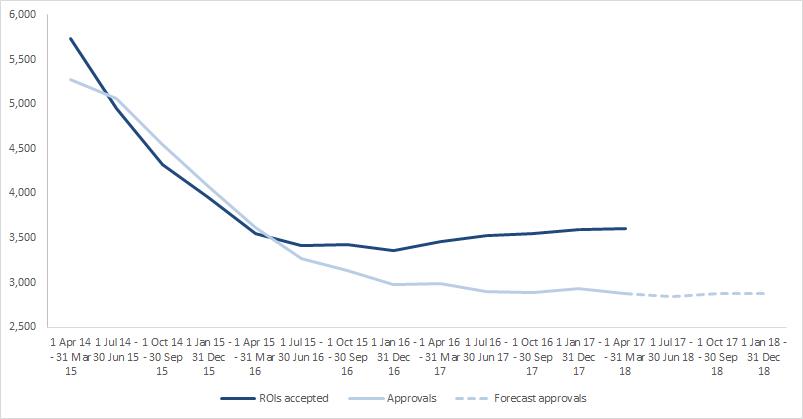
- The number of Registrations of Interest (ROIs) accepted has continued to rise slowly, which should lead to an increase in the number of adopters approved though we are not likely to see this until 2018/19 unless the ROI to approval conversion rate improves.
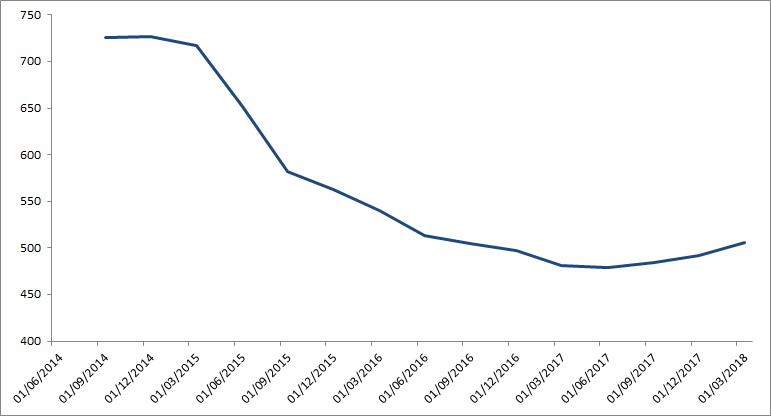
- Waiting times for children not yet placed continue to worsen, with performance back to the level last seen in September 2016.
With this in mind, the key question is how long will it be before the situation improves? I have been working on a model that I hope will give us a means to answer this.
Predicting the future
Any model has to incorporate a number of assumptions. For example, data on the number of children whose plan changes from adoption and the number of approved adopter who resign are not published at the moment but they are key elements to predicting how many children and adopters will be in the system at a given time. Also, it assumes that the ability of social workers to assess the suitability of people to be adopters is relatively consistent over time.
Even though data is not published in theory it is possible to calculate how many children had a change of plan each quarter, as once a PO is granted for a child the only possible outcomes in each quarter are: the child is placed for adoption, the child continues to wait or the plan for the child changes. Therefore to estimate the number of changes of plan each quarter I have used the following formula:
The number of children with a PO but not yet placed at the end of quarter A + the number of children granted a PO in quarter B – the number of children placed in quarter B – the number of children with a PO but not yet placed at the end of quarter B
I have put in a request for the actual data, which I hope will be provided later this month, but for now this gives me a reasonable proxy.
Similarly it is possible to calculate the number of approved adopters who resign because the only possible outcomes for an approved adopter are: the adopter is matched, the adopter continues to wait or the adopter resigns. So the formula I have used is:
The number of adoptive families available at the end of quarter A + the number of adoptive families approved in quarter B – the number of adoptive families matched in quarter B – the number of adoptive families available at the end of quarter B
Do you think these two formulae are correct?
The basis of my model is a correlation that I have discovered recently. I had hypothesized that the chances of a child being matched for adoption would depend on how many families were available – this seemed logical to me as a shortage of adopters would limit the number of children who could be matched.
So I decided to compare these two factors – the chart below shows the adopter gap (red) and the chances of a child being placed (blue) for each quarter since 1 April 2014.
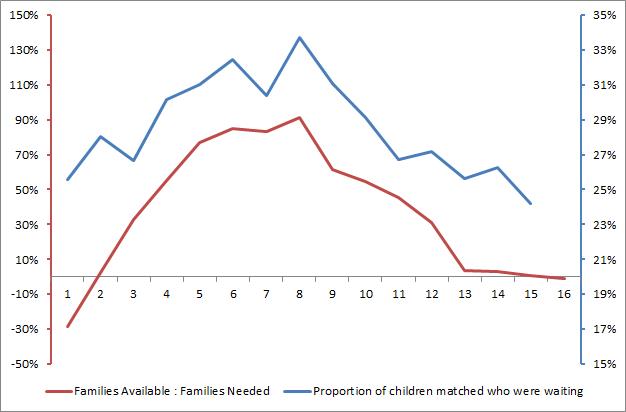
The adopter gap compares how many families are available to how many are needed – 0% means the number of families available is equal to the number needed, a negative number means we do not have enough families and a positive number means there are more families available than are needed
To calculate the chances of a child being matched, I have looked at the number of children matched in a quarter compared with the number of children who were available to be matched that quarter – hence 0% would mean no children were matched and 100% would mean all the available children had been matched.
As the published data is estimated, rounded and aggregated, the charts have jagged lines. However, when I calculate the trend lines for each indicator there is a clear correlation between the two:
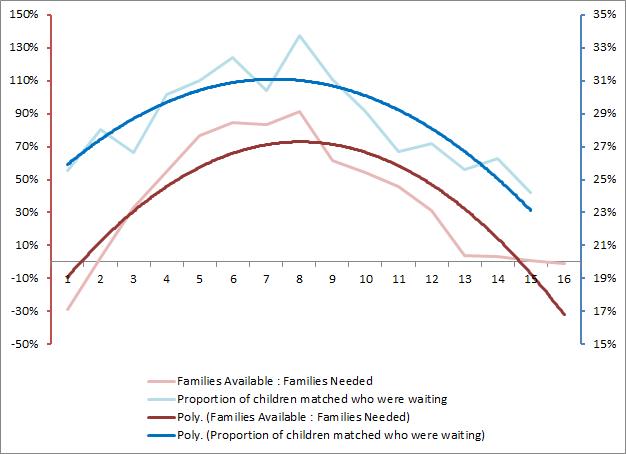
This clearly shows that both sets of data follow a similar path.
This correlation gives me a means of predicting what percentage of children would be placed in a quarter based on the adopter gap at the end of the previous quarter – a unique insight.
The model also requires assumptions to be made on the number of BIDs, changes of plan, accepted ROIs and adopter resignations there will be in the future, as these determine the flow in and out of the system. For example, let’s assume that in 2018/19 there will be:
- 200 plans changed post-PO (approx 180 in 2017/18)
- 4,400 BIDs (the lowest since 2014 is 4,580 from July 2014 to June 2015)
- 440 adopter resignations (approx 450 in 2017/18)
- 4,000 ROIs accepted (the last time there were this many was January to December 2015)
With these assumptions my model predicts that the current shortfall in adopters would not be eliminated until Q3 2019/20 (a year from now). I think this is an optimistic view – from speaking to agencies they are seeing a rise in the number of BIDs this year, so 4,400 is probably a low estimate. If 4,800 BIDs are made in 2018/19 (compared with 4,970 in 2017/18) then we would need 4,400 ROIs accepted to close the adopter gap by Q3 2019/20. With these parameters I estimate that 3,500 children would be matched in 2018/19 and 2,700 children would be waiting on 31 March 2019.
I believe this takes me one step closer to answering a question I have had for a while – how much ‘choice’ do we need in the system? We know that simply having an adopter gap of 0% is not enough – if it was we would be matching all the children waiting. Clearly not having enough families makes it impossible to match all children, but how big a surplus should we be aiming for if we want to match children an average of 4 months after a Placement Order is granted?
The missing piece for me now is to determine what, if anything, influences the volume of changes of plan and adopter resignations. As you can see, it is possible to use this model without this insight and it might not add anything, but there is only way of being sure. Hopefully this data will be available one day soon.
What do you think of this analysis and the concept of ‘choice’? Please add your comments and questions below so that we can develop this thinking together.
If you would like support from Coram-i to develop sufficiency plans for adoption or fostering then contact us.
You may also be interested in reading:
Adoption in England – a system under pressure?